
Beyond the Proposal – What Boards Should Review in IUL-Funded Executive Benefit Plans
Boards reviewing executive benefit plans, such as split-dollar, typically receive a proposal anchoring the discussion. It presents the projected income at retirement, the projected cash value, and the long-term tax treatment of the arrangement. The supporting compliant illustration sits behind the proposal. The structural choices that drive the projections sit behind the illustration: the design at issue and the contractual provisions governing how the carrier operates the policy over time.
Most decisions get made based on the proposal. But the details that drive actual outcomes live in the illustration.
Two policies described generically as “indexed universal life” (IUL) can produce drastically different results. The differences fall into two categories: i) how the policy is structured at issue, and ii) what the carrier reserves the right to adjust after the policy is issued. Both shape the eventual outcome. But neither typically receives detailed attention at the proposal stage.
Long-term IUL outcomes depend on future index performance, future credited cap rates, future loan rate behavior, and the cost structure inside the policy over time. None of those variables are within a board’s control.
A board can evaluate two things at the outset: how the policy is designed, and how much of what is illustrated rests on non-guaranteed elements rather than the contractual provisions that limit how the carrier can operate the policy.
Same Carrier, Two Designs: The Decision Made Before the Proposal
By isolating one variable, how the policy is structured within a single carrier, the effect of design can be measured directly. Consider two IUL policies issued by the same carrier on the same insured, funded with $500,000 annually for seven years, both illustrated at the same 6.35% maximum illustrated rate. That is the highest rate either policy is allowed to show, which takes crediting off the table, leaving design as the only thing that moves.
The only variable changed was design.
- Design A: Off-the-shelf structure (standard Basic Coverage allocation, maximum commissionable target premium)
- Design B: Maximum blend (minimum Basic Coverage, maximum allowable term rider allocation, minimum commissionable target premium)
Unlike whole life, IUL does not contain a base / paid-up additions allocation. The structural lever is the mix of Basic Coverage and term rider coverage that comprises the total death benefit. Basic Coverage carries higher total charges than the term rider and carries the policy’s commissionable target premium, the figure used to size acquisition compensation. A design that shifts coverage from Basic to the term rider reduces commissions, reduces internal load, and reduces the cost drag on accumulation. The premium paid into the policy is the same. The internal cost loaded against that premium is not.
In the illustrations modeled, the off-the-shelf design carries a Target Premium of $351,282. The blended design carries a Target Premium of $60,818. That is an 83% reduction in commissionable target premium exposure on identical total premiums.
The effect on cash value shows up in the first year and compounds across long-term outcomes.
Two Designs. One Premium. Same Insurer. Different Outcomes.
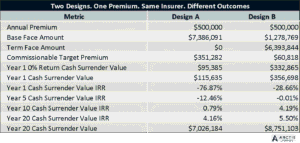
At end of Year 1, the off-the-shelf design retains $115,635 in net cash surrender value at the illustrated rate. The blended design retains $356,698. The structural choice has roughly tripled early cash retention.
Internal rate of return on cash value tells the same story. Design B reaches positive IRR during policy year 6, within the funding period. Design A does not reach positive IRR until policy year 10, three years after the final premium is paid.
At end of Year 20, immediately before illustrated income begins, the off-the-shelf design holds $7,026,184 in net cash surrender value. The blended design holds $8,751,103.
None of that gap comes from performance. Same carrier, same illustrated assumptions, same premium. What changed is how the policy was built.
Year 1 is not theoretical for boards overseeing executive benefit plans. Executive arrangements introduce employment risk, separation risk, redesign risk, and liquidity considerations. The executives’ retirement income is also on the line. A design that holds $356,698 of a $500,000 first-year premium and one that holds $115,635 are not the same risk to the organization. The same goes for breakeven: crossed during the funding period, or three years after the last premium is paid.
One more design element bears on early cash value. IUL carriers offer two types of early cash value riders. The first waives surrender charges, bringing the surrender value up to the accumulation value; the charges vary by carrier, but the drag on performance is modest. The second brings the surrender value to cumulative premiums, or close to it, and the drag on long-term performance is substantial. Either rider can be added to either structure. A rider on the off-the-shelf design raises the surrender value without touching the internal costs that produced the low number in the first place. A board shown strong early cash value should ask whether it comes from the policy’s architecture or from a rider, and what the rider costs over the life of the policy.
The Low Point: 0% Return
Lenders in premium finance ask for a policy’s low point before they ask for much else: the minimum cash value if indexed crediting goes to zero while current charges remain in place. It is a narrower question than the guaranteed values, which pair zero crediting with maximum charges for the life of the policy, and it is the right question for anyone with early-year exposure to the policy. Boards funding executive benefit plans have that exposure, specifically in split-dollar and restricted bonus arrangements with repayment obligations, and rarely ask.
At the low point, the off-the-shelf design holds $95,385 at end of Year 1. The blended design holds $332,865. At end of Year 7, the final funding year, the blended design holds $3,122,137 against $3,870,680 at the illustrated rate. Cumulative premium through Year 7 is $3,500,000; even with crediting at 0% for the entire funding period, the design preserves 89% of what was paid in.
Design does the protective work early. A board evaluating a plan that may be unwound, restructured, or collateralized in its early years should focus on the low point through the funding period. A plan intended to run for decades is exposed on both fronts: the design’s cost drag compounds for the life of the policy, and carrier provisions determine how much of the illustrated outcome may arrive.
Same Architecture, Different Carrier
Hold design constant and the second variable comes into view. Consider two policies, both structured at the minimum face amount permissible under the carrier’s product with the maximum allowable term rider allocation, both funded at $500,000 annually for seven years, both illustrated at the same 6.35% maximum illustrated rate, on the same Male age 45 Standard Non-Tobacco insured.
The only variable changed was the issuing carrier.
One Design. One Premium. Different Insurers.
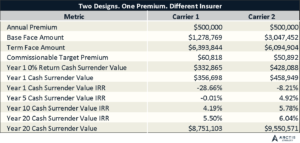
Carrier 2 retains more cash value than Carrier 1 at every measurement point during accumulation. At end of Year 1, Carrier 2 holds $458,949 against Carrier 1’s $356,698. At end of Year 20, immediately before distributions begin, Carrier 2 holds $9,550,571 against Carrier 1’s $8,751,103.
Briefly on target premium across carriers. The two policies carry comparable target premiums in dollar terms ($60,818 and $50,892), but the commission percentages the carriers apply to those target premiums differ substantially. Cross-carrier comparisons involve two compensation variables, not one: target premium and the commission percentage paid on it. Boards reviewing alternative carrier proposals should ask for both.
On cash value, Carrier 2 leads at every point. Yet Carrier 1 illustrates the higher distribution income. The explanation is not in the accumulation economics. It is in the provisions.
Current Company Practice vs Contractual Provisions: The Gap That Exposes Boards and Executives
The distinction needs definition. Non-guaranteed elements are what the carrier is currently doing: the cap it currently credits, the charges it currently assesses, the credits it currently pays, the loan rates it currently sets. Contractual provisions are the limits: the maximum charges, minimum caps, and rate boundaries the contract permits. An IUL illustration is built almost entirely on the first. The risk lives in the distance between the two.
The carrier comparison shows why. Carrier 1 enters distribution with less cash value and illustrates more income. Accumulation value is not a reliable proxy for distributable income. The advantage comes from carrier-specific elements that are currently favorable but not contractually required.
Four areas of carrier discretion warrant attention.
Cap rate. Both carriers currently credit a 10% cap on the primary indexed account. The more telling number is the trajectory. Caps on many IUL products sat above 12% a decade ago; many of those same products sit near 7% today. The exposure runs deeper than the cap itself: the 6.35% maximum illustrated rate is derived from the current cap, so every projection in this article rests on the assumption that today’s cap persists for decades. A multi-decade projection built on today’s cap embeds an assumption the carrier resets at its discretion, down to contractual minimums of 2% and 3% on these two contracts. In these illustrated policies, the participation rate is not the discretionary lever; the cap is where the carrier’s adjustment authority sits.
Policy charges. Cost of insurance and other policy charges are illustrated at current levels. The contracts permit maximums. The gap between current and maximum is carrier discretion the illustration does not show.
Persistency credit (bonus). Carrier 1’s illustration includes a non-guaranteed persistency credit, sometimes called a bonus, beginning in policy year 11 and continuing through the life of the policy. The illustration describes the credit as one that “may apply,” not as a contractual entitlement. Carrier 2’s contract does not include one. The credit is the largest single driver of Carrier 1’s illustrated income advantage. The carrier illustrating the higher long-term income is doing so partly on a credit the contract does not require it to pay.
Loan rates. Most carriers maintain a current loan charge rate and a contractual maximum, and illustrate the current. Not all reserve the discretion; some carriers fix the loan charge rate contractually. Where the discretion exists, the illustration can be rerun at the maximum loan rate, and boards should ask for that run.
Loan type matters as much as loan rate. The two dominant structures are standard loans and indexed (participating) loans. With a standard loan, the rate charged and the rate credited on the loaned balance are both set by the carrier. With a participating loan, the loaned balance stays in the indexed account, and the illustration assumes crediting beats the loan charge year after year. Vendors typically illustrate participating loans because the assumed arbitrage produces the highest income. That is the danger: the arbitrage is a static assumption, and when credited rates compress below the loan rate, participating loans erode the policy faster than standard loans would have.
The illustrations above use standard loans operating as wash loans during distribution. Carrier 1 currently charges 2.25% on standard loans against current crediting of 2.00% in years 1 through 5 and 2.25% thereafter, with a guaranteed maximum spread of 1 percentage point. Its participating loan currently charges 5.25% against a contractual maximum of 8.00%. Carrier 2 carries a 2.00% charge after policy year 9 with a 2.00% guaranteed credit.
Overloan protection riders, where offered, are intended to prevent lapse when loan balances approach total cash value. The riders are heavily marketed in this space, so one caveat belongs on the record: the tax outcome the rider is designed to protect, avoiding income recognition on a lapse with outstanding loans, has never been addressed by the IRS in any ruling or guidance. Terms vary by carrier and warrant evaluation at issue, not at the point of distress.
The higher-illustrating carrier is not doing anything wrong. The illustration accurately reflects its current company practice. But current company practice and contractual provisions are not the same commitment. A board relying on the illustration is relying on the persistency credit continuing, the loan spread holding, and the cap remaining where it sits today. The contract guarantees none of those.
All IUL carriers reserve discretion. The variation across carriers is in how much of the illustrated outcome depends on the carrier continuing to operate at current levels.
Governance Implications
Indexed universal life is often presented as only a product decision. It is also a design question and a contract question: how the policy is structured at issue, and how much room the carrier reserves to operate the policy differently over time.
Design and contractual provisions meaningfully alter:
- Early available cash value
- Breakeven timing, including whether breakeven occurs during the funding period or only after it ends
- The policy’s low point during the funding period
- The distribution rate the policy can sustain
- Collateral profile in split-dollar arrangements
- Sensitivity to changes in caps, charges, persistency credits, and loan rates
- Target premium and commissionable acquisition load
Two policies illustrated identically can behave very differently.
Boards evaluating IUL-funded executive benefit plans should require clarity on:
Design
- The face amount selected, the split between Basic Coverage and term rider coverage, and the rationale for the allocation
- Target premium under the design as illustrated, the target premium under alternative designs, and the commission percentage applied to target premium
- Whether any early cash value rider is included, which type, and its charge over the life of the policy
Early-year exposure
- The policy’s low point: cash value at 0% crediting with current charges at end of Year 1 and at end of the funding period
- The year in which projected IRR on cash value crosses positive
- The annual policy charge summary for the design as illustrated and for alternative designs, showing total charges over the funding period
Carrier discretion
- The current cap rate, where the carrier’s caps stood five and ten years ago, the contractual minimum cap, and the guaranteed minimum crediting rate on the fixed account
- Whether any persistency credit, bonus, or multiplier feature is illustrated, whether it is contractually required, and the impact on illustrated income if it is reduced or eliminated
- The maximum contractual cost of insurance and other policy charges, compared to current
Distribution
- The loan type illustrated (standard or participating), the current and maximum loan charge rates, and the projected outcome at the maximum
- The presence and terms of any overloan protection rider, noting that the IRS has not opined on the rider’s intended tax outcome
Illustrated income and current crediting rates matter. They do not substitute for structural review.
IUL is not simply IUL. Design determines the foundation. Provisions determine the carrier’s discretion. Both determine risk.
Alexander Bebis
Owner / President
Author
Alexander Bebis is an independent executive benefit consultant focused on the governance, design, and oversight of non-qualified benefit arrangements for credit unions and nonprofit organizations. His work centers on helping boards and leadership teams evaluate structure, assumptions, and long-term economic tradeoffs in executive
benefit plans.
Need Independent Insight?
Contact us at: (508)-972-8523 or info@arctisadvisory.com
